

DB-Lock-Issues with Transactional REQUIRES_NEW — More Spring/Java transaction handling pitfalls


Photo by Jason Blackeye on Unsplash
If you haven’t read it yet, it’s probably a good idea to read part 1 of this post-series first.
From now on we’ll assume that we remember roughly what part 1 was about. As a refresher, here’s one of the main points again:
What is Propagation.REQUIRES_NEW?
One may think that it “magically tells the database to make a nested transaction”. However this mental model is wrong — many Databases don’t even have nested transactions, so something else needs to happen.
What actually happens is that Spring will open a new connection to the database.
In part 1, we already learned that a side-effect of this is that control-flows that need a transaction initially and then use propagation=REQUIRES_NEW later on as well, need 2 database-connections. And as we saw, this can even lead to deadlock situations, if all connections from the pool are in use by threads that in turn all wait for yet another connection. That may happen if they all finished some initial processing and are now all waiting at the REQUIRES_NEW boundary for their second connection they’ll “never” get. In reality you can hope for your connection-pool being configured with a timeout that will eventually resolve the situation.
We also explained, that there is another issue that can arise where execution can get stuck. This scenario (called scenario 2 in the first post) does not even require multiple threads at all. This is what we’ll explore in more detail in this post.
A Little Story
This time, we’ll start with a little story to explain how we might end up with code that runs into this problem in a real-world situation.
Day 1:
PO: We want to have a protocol/log in our database of all user triggered actions.
DEV: Easy enough, I’ll create a new table and a service which simplifies this. It takes the user-ID and some text that describes what happened.
Day 2:
PO: The feature works great, but it has come to my attention that if the user tries to perform a task & it fails with a server-error, we don’t see any log-entry in the DB that the action was tried.
DEV: Ah yes, that’s because of transactionality and rollbacks. Since our log-code takes part in the main transaction, if something — an exception happening later when the action is actually run— happens, it also rolls back our protocol. But that’s easy to fix, we’ll just use REQUIRES_NEW as the propagation level, then the protocol-code won’t be affected by the other rollback.
Day 3:
PO: The changes work great. Today we got a new authentication proxy, if that sends a certain http-header, our system should automatically create a new user on the fly. This could happen on any request to our system.
DEV: Sure thing, no problem, we’ll just use a filter that is called on any request, that will always work™.
There we have it, now (depending on how the transaction-handling is done) we may now very likely have a situation where we’ll get a deadlock on the database-level.
To the Code!
The example repository lives here: https://github.com/NoUsername/transactions-handlinge-issue-2
Sidenote: the code doesn’t totally reflect what the story told. For simplicity we’re using a simple service and no request filter.
The important part we’ll want to look at is this snippet form the UserService:
@Transactional
fun signup(name: String) {
    // shortened
    val user = userRepository.save(
        User(
            name = name,
            signupDateTime = LocalDateTime.now()
        )
    )
   // NOTE: this uses @Transactional(propagation = REQUIRES_NEW)
   userLogService.logUserAction(user.id!!, "User signed up")
   // shortened
}
The logUserAction function will try to write a protocol of what action is happening related to that user, however that won’t work. It will simply block on the database (for a few seconds before failing).
What’s the Problem here?
The problem is, that we’re using 2 database connections and operating on related data.
Let’s go through it step-by-step: We have our “outer” Transaction (O) opened by the signup method and we have our “inner” Transaction (I) opened by logUserAction.
(O) writes new user with ID=1 to the USER table — does not commit yet
(I) tries to write an entry to the USER_LOG table referring to a USER entry with ID=1.
Since the DB is smart enough to realize that (I) would be able to finish, if only (O) would commit, it makes (I) wait for (O). What the DB can’t know is that our application does exactly the opposite. Our application waits for the (I) transaction to finish committing, before it would go on to let (O) finish — so (O) waits for (I).
This should sound familiar again, because this is exactly the deadlocking pattern: two sides waiting on resources in exactly the opposite order.
Simply put, imagine opening 2 SQL-Clients (without auto-commit) and entering this command in the first one:
INSERT INTO USER (id, name) VALUES (1, 'foo');
-- no commit yet
And in the second client running:
INSERT INTO USER_LOG
  (id, user_id, message)
 VALUES
  (123, 1, 'message');
COMMIT;
We would see in the second client, that the commit does not go through yet, because we try to refer to uncommitted data in a foreign-key.
This is exactly what is happening behind the scenes in our application.
No blogpost of mine would be complete without a crappy drawing, so here you go:
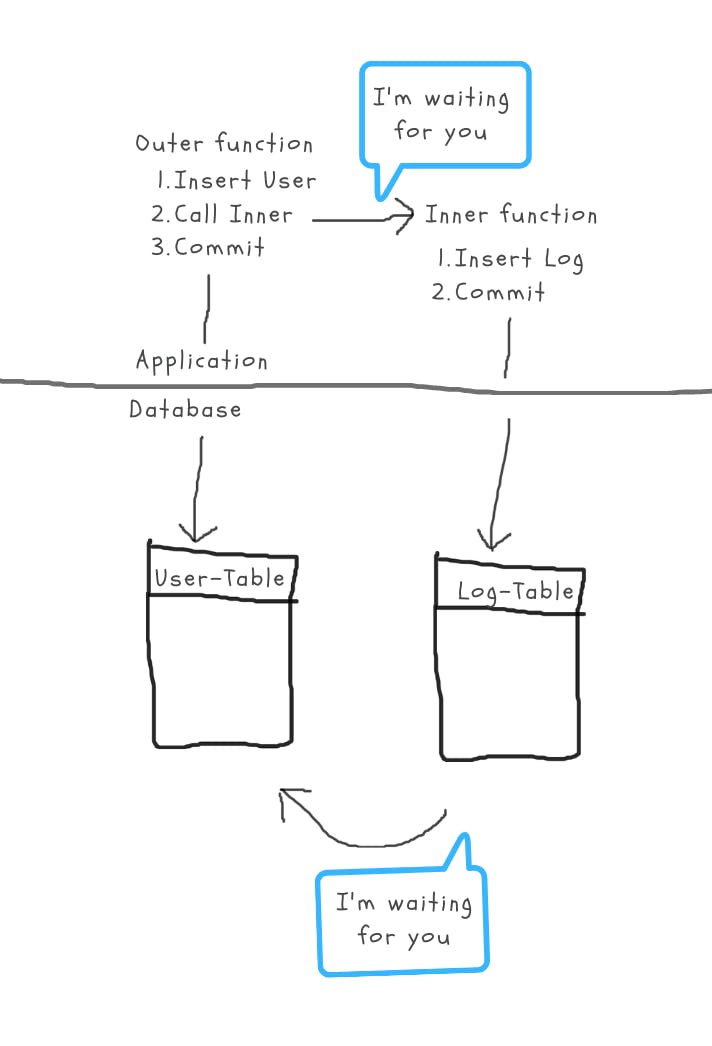
Typical circular waiting deadlock pattern
“But I would never write this Code”
Of course we would never write this code. But as we saw in the story (and as it usually goes in real-life) the code is much more complex in your production application. That certain control-flow that triggers the bug typically only happens in very rare conditions which typically aren’t covered by tests.
As in our story: the “create user” code would not be visible directly. Instead it would be hidden in some request-filter or even another module.
Reality Check
Granted, many (most/all but I can only speak for MariaDb and MsSql in recent versions that do this) database systems don’t really let those connections deadlock. They have some built-in timeout, which will then return an error to the callers. But this still means:
- Our application (the request-thread, and db-connections) will be blocked for several seconds typically.
- The action we tried to take (db write operations) will fail.
So how would we even find this Issue in our Code?
As always with software-issues, a great first step is if we can reproduce the issue 😁
So let’s trigger a request that causes the issue (POST to /signup) and then take a thread-dump to see where our application is actually hanging, which will show us something like this:
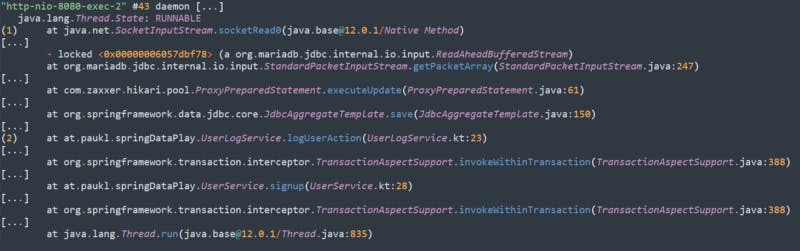
Simplified & annotated Stacktrace
What this shows us is that at (1) the thread is currently waiting to hear back from the Database. And at (2) we see that it’s currently in the process of writing the user-log entry to the DB. If we would check back a few seconds later, the stacktrace would still look the same (no progress).
If we have turned on application-logging, that would confirm this state.
Since we’re waiting for the database itself, that’s the place we should turn to next. Because how should our application know why the database isn’t responding?
There are a few useful commands that can help us figure things out, like:
SHOW FULL PROCESSLIST;
SHOW ENGINE INNODB STATUS;
However, if we want to see an already simplified view on which queries are currently being blocked and by what, this article has this nice query for us:
SELECT r.trx_id              waiting_trx_id,
       r.trx_mysql_thread_id waiting_thread,
       r.trx_query           waiting_query,
       b.trx_id              blocking_trx_id,
       b.trx_mysql_thread_id blocking_thread,
       b.trx_query           blocking_query
FROM information_schema.innodb_lock_waits w
         INNER JOIN information_schema.innodb_trx b
             ON b.trx_id = w.blocking_trx_id
         INNER JOIN information_schema.innodb_trx r
             ON r.trx_id = w.requesting_trx_id;
In our case this would show something like the following result:

Result of the blocking connection analysis query
If we are impatient and ran the test-query multiple times in parallel, we would even see multiple such lines.
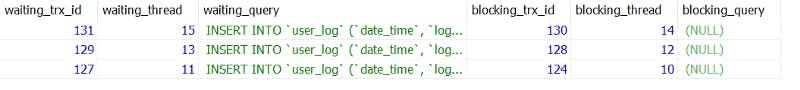
Notice how the waiting_thread and blocking_thread values do not overlap. Each insert into the user_log table is blocked by it’s corresponding insert into the user table.
Sadly the blocking_query doesn’t show the actual query that was previously executed in this db-thread/transaction. We could get to it, if we would have turned on the performance_schema, thereby having access to historic query data. But that’s out-of-scope of this article.
How do we fix this?
As in part 1 of the series, it’s again a good idea to question using REQUIRES_NEW.
What can we do instead, if we don’t want to use the independence of transactions? Serialize the database access. What we mean by that is not related to storing things in binary/text format, but instead getting rid of concurrency.
“Concurrency? But we’re only talking about single threads?” > doing a quick internet search on “concurrency vs. parallelism” will clear that up. Since REQUIRES_NEW opens a new DB-connection, we are always concurrently using these 2 resources.
So serializing the database access means first completing one transaction before starting the next.
A simple way to do that is for example leverage Spring’s TransactionSynchronizationManager:
// Propagation.MANDATORY makes sure a transaction is ongoing
// so we have something to "sync to"
@Transactional(propagation = Propagation.MANDATORY)
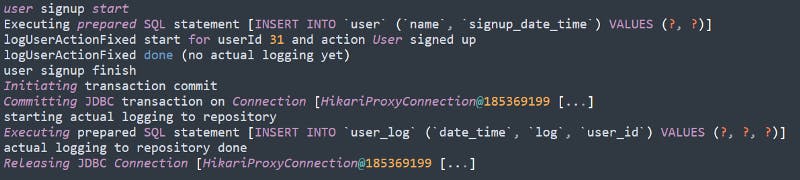
fun logUserActionFixed(userId: Long, action: String) {
LOG.info("logUserActionFixed start for userId {} and action {}",
userId, action)
TransactionSynchronizationManager
.registerSynchronization(object : TransactionSynchronization {
override fun afterCompletion(status: Int) {
// NOTE: we could even check if the initial transaction
// failed or succeeded via the status parameter
LOG.info("starting actual logging to repository")
userLogRepository.save(
UserLog(
userId = userId,
dateTime = LocalDateTime.now(),
log = action
)
)
LOG.info("actual logging to repository done")
}
})
LOG.info("logUserActionFixed done (no actual logging yet)")
}
This will lead to the actual execution looking something like this — in our logs:
Another way would be to go a more extreme route and use some form of messaging (like JMS) to postpone the action. Even in that case we should be careful that the JMS message is only sent at the end of the transaction, otherwise we might still run into race-conditions.
Wrapping up
After “Pool Locking” in the first part article, we’ve now also seen the second potential deadlock scenario “Database Locking” in action. Both these issues are results of what
@Transactional(propagation = Propagation.REQUIRES_NEW)
does under the hood. Should we never use Propagation.REQUIRES_NEW? Never say never. There may be cases where this is the cleanest and quickest solution AND we are sure that it isn’t a problem (because we somehow ensured it). Issues may still arise later, if some aspect of the code is changed and suddenly there might be a case where we run into these problems.
So what should be our takeaway? Every time we see Propagation.REQUIRES_NEW in a codebase, we should at least switch into our alert/danger/spidy-sense-is-tingling mode and double-check what is going on. Maybe ask ourselves these questions:
- Were these potential problems considered when writing this code?
- How is the DB-pool configured?
- Is concurrency limited when it comes to calling this code?
- What data (tables) is accessed inside this code and which ones outside (before) calling this? Typically we only care about write-access here.
So there’s quite a list of things to check before being able to say that we’re reasonably sure that this little REQUIRES_NEW won’t come back to bite us.
And finally, how did we magically come to this knowledge? Well of course things went wrong in real world scenarios. Hint: your inner locking DB-access could even be hidden inside some stored-procedure, for extra “ease” of debugging 😋